Reports and Resources
Convincing decision makers to prioritize people who bike and walk requires two things: great stories and great data. Our reports offer important, easy to understand case studies for both.
As the premier resource for advocates and policy makers on how to make biking better, the League has produced scores of reports and fact sheets over the years to make the case for building a Bicycle Friendly America for everyone.
In addition to our most recent reports, the League also hosts archives and resources created over the years through our work and that of our partners.
Can't find a report you're searching for? Contact us.

Recent Posts from our Research Team

Bike Researchers: Safety Report ‘Misleading’
Their claim that bicycling has become much more dangerous is based on only data from 2010 to 2012 and is extremely misleading. Using official data from the US Department of Transportation, the total number of bike trips more than tripled from 1,272 million in 1977 to 4,081 million in 2009. During the same period, the number of cyclist fatalities fell from 922 in 1977 to 628 in 2009, a decrease of 32%. Taking into account the increased level of cycling, the cyclist fatality rate fell by a dramatic 79%. In short, cycling has become roughly four times safer per bike trip over the past three decades.

Govs Highway Safety Assoc: You’re on Your Own
If all you read was the press release of a new report by the Governors Highway Safety Association (GHSA), “Bicyclist Safety,” you would be forgiven if your take-away was: More bicyclists are being killed on American roads but they’re mostly helmet-less drunks — and there aren’t enough deaths to make it a national issue anyway. The tone-deaf press release focuses on the share of fatalities of helmet-less riders and those with a high blood-alcohol level, without a single mention of speeding or driving behavior, and only a passing reference to Complete Streets.

Revised: Bike Data Breakdown
Last week, we released our Where We Ride report, analyzing U.S. Census Bureau data on national bike commuting trends. Shortly following our release of the report, we became aware of more comprehensive data that should be included in the report. Today, we’re releasing our revised Where We Ride report, with more communities and data points included. Download it here.
Gearing Up Political Engagement
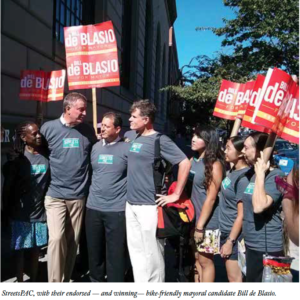
Imagine you’re a safe-streets advocate living in a dreamscape of an expanding bike-lane network, widespread installation of public plazas and innovative government-sponsored programs aimed at improving street life, from summertime street closures to bike share to virtually on-demand public benches. Progress has been swift under the committed leadership of a mayor who understands the economic necessity of these programs and amenities to ensure that his city stays competitive — and his Commissioner of Transportation is unapologetically on the cutting edge of contemporary urban design.
Updated: Bike Commute Data Released
UPDATE: We’ve released an extensive analysis of the new bike commuting data in a new report called “Where We Ride: An Analysis of Bicycle Commuting in American Cities.” Click here to download it (PDF), or scroll through the report below. This morning, the American Community Survey (ACS) released new data on bicycle commuting in the United States.
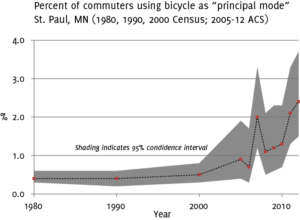
Bicycle-blind: Cycling data in the U.S.
Perhaps the most widely used dataset related to bicycling in the United States is the annual American Community Survey (ACS), the successor to the decennial Census’ so-called “long form.” This survey asks a sub-sample of American households to provide information on a variety of topics such as income, health insurance, disability, housing, and—thankfully—transportation.