Reports and Resources
Convincing decision makers to prioritize people who bike and walk requires two things: great stories and great data. Our reports offer important, easy to understand case studies for both.
As the premier resource for advocates and policy makers on how to make biking better, the League has produced scores of reports and fact sheets over the years to make the case for building a Bicycle Friendly America for everyone.
In addition to our most recent reports, the League also hosts archives and resources created over the years through our work and that of our partners.
Can't find a report you're searching for? Contact us.
Recent Posts from our Research Team

Webinar: Why Women Are Essential
This number — 51% — made me think. How much of what we say about women is true and how much is myth? And how much has the bike retail industry bought into, and continued to sell these myths right back to women? I was overwhelmed by how well the webinar was attended. It’s an indicator to me of how invested the industry is in seeking out numbers-based solutions. The other thing that got me excited was how interested folks were in continuing the conversation. We have these numbers that indicate a huge potential for growth in women’s bike retail, but what about solutions to capitalize on that potential? How do we fix it? How do we get more women on bikes?
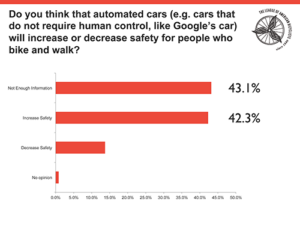
Survey: Bicyclists Unsure of Connected and Automated Car Technology
Last Friday I spoke to researchers, agency staff, and industry at the fall meeting of the Technologies for Safe and Efficient Transportation (T-SET) University Transportation Center (UTC) at Carnegie Mellon University (CMU) in Pittsburgh, PA. CMU and the University of Pennsylvania are partners in the US DOT funded UTC that is one of up to 35 UTCs that are funded under MAP-21 with up to $72.5 million per year being allocated to research on a competitive basis. The CMU/UPenn UTC has a strategic goal of safety.

Tell Census Bicyclists Count
How do we know how many people are biking? In most cases, we rely upon the American Community Survey. Each year the Census Bureau releases data on how people get to work, including whether they bike to work. This is the most consistent and widespread data on the number of people regularly biking in the United States. We use it in many ways -– to compare cities large and small, to evaluate communities and states using Bicycle Friendly America programs, and to better understand bicycle safety.
FAQ: Every Bicyclist Counts
Our Every Bicyclists Counts report has generated quite a lot of discussion since its release last month, which is good. That’s why we do these things! We’ve heard everything from heartfelt “thanks” for digging into a genuinely difficult topic to the despairing “what am I supposed to teach my students now.” Let me see if I can provide a little more commentary and context to address some of the more frequent questions we’ve been getting.

New Report: Every Bicyclist Counts
A terrible string of fatal bike crashes in the Tampa area in late 2011 and early 2012 left the local bike community reeling. As they shared each awful tragedy with us, we too felt frustrated and powerless. We also realized how little we really knew about the circumstances of serious crashes between bikes and cars, and how woefully inadequate (and late) the available data was at the national level.
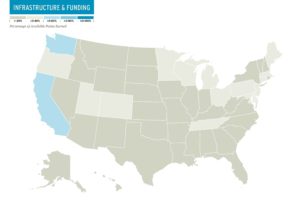
BFS: Infrastructure & Funding
The Infrastructure & Funding category has long been one of the lower scoring categories that make up our Bicycle Friendly State rankings. In this category we ask tough questions about the infrastructure that is actually on the ground, the money from state and federal programs actually committed to bicycling and walking, and state goals and policies that affect funding and building decisions. When looking at long-term average spending on bicycling and walking as a percentage of all federal transportation funds, we see that less than 2% has been spent on bicycling and walking projects. It is not particularly surprising then that states tend to score low in this category.