DISCOVER YOUR LOCAL BICYCLING COMMUNITY
Find local advocacy groups, bike shops, instructors, clubs, classes and more!
Bicycle-blind: Cycling data in the U.S.
This guest post comes to us from Dr. Michael Smart, a professor of planning and public policy at Rutgers University and a panelist at Future Bike. The U.S. Census Bureau recently released its 2013 data on bike commuting nationwide. You can see our analysis of those numbers here and our methodology here.
Perhaps the most widely used dataset related to bicycling in the United States is the annual American Community Survey (ACS), the successor to the decennial Census’ so-called “long form.” This survey asks a sub-sample of American households to provide information on a variety of topics such as income, health insurance, disability, housing, and—thankfully—transportation.
Like many transportation datasets, the ACS focuses on the journey to work, a surprisingly small and shrinking share of overall travel in the US. While travel to and from work comprises only about 16 percent of our daily trips, the fact that most people commute at the same time is a principal driver of traffic congestion in cities. This, probably, is the reason we are so fixated on such a small portion of overall travel.
For bicycle planners, researchers and advocates, this poses a problem. Even more than for other modes, the vast majority of bicycling is done not for the journey to work, but for other reasons. In fact, cycling for recreation and socializing alone account for at least one-third of all cycling in the United States. The ACS does not help us here.
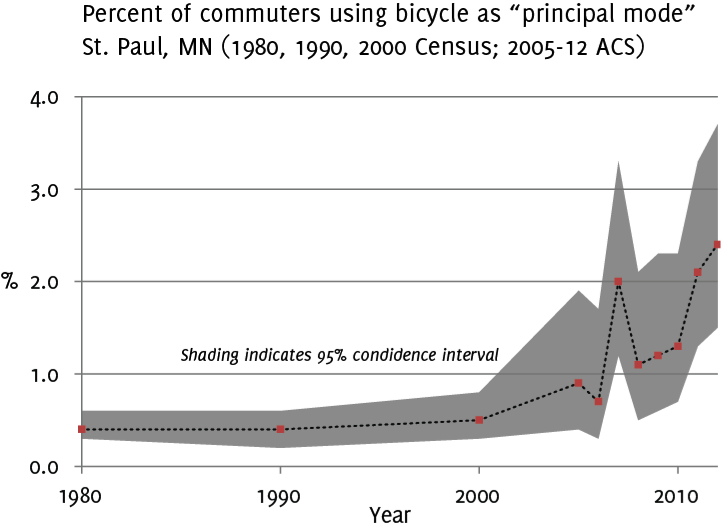
Yet despite this drawback, the American Community Survey is in many ways an improvement over the Census long form that it replaced. As the figure below shows, from 2005 onward commute data have been available annually for many cities in the United States. This degree of temporal granularity aids in the tracking of trends, one of the most common forms of bicycle-related number-crunching. However, as the figure below illustrates, the accuracy of these estimates has eroded with the introduction of the ACS, as the Census has balanced frequency of surveying (annual rather than decennial) with a considerably smaller sample size.
The data, unfortunately, become even less reliable when we begin to look at particular sub-populations. The graph below shows estimates of the percent of commuting men and women who used bicycles in St. Paul over the years. As above, the shading indicates a 95 percent confidence interval. For the years where these confidence intervals intersect (the greyish areas), we cannot say with statistical confidence that male commuters in St. Paul cycled to work more than female commuters. (Of, course the trends are highly suggestive.)

The ACS is not the only dataset available. The federal government conducts a large national survey of travel patterns known as the National Household Travel Survey. This survey asks respondents to provide a wealth of data about all members of the respondent’s household, including a detailed travel diary of each family member’s travel patterns for a single 24-hour period. However, the dataset is conducted only at irregular intervals (the most recent were in 1995, 2001, and 2009), and the survey is designed for analysis at the national scale only. While national trends are important, many of the research questions the bicycle community has are best asked at the regional, municipal or— more often than not— the neighborhood level. Further, many questions related to equity are thwarted by the NHTS’ vexing choice to assign one race to an entire household, rendering the “race” variable frustratingly fuzzy.
Regional planning agencies conduct transportation surveys of their own, and these surveys can provide high-quality travel data at very small units of geography. Yet in their current form, these are unlikely to be of much use to bicycle advocates, planners, and scholars. For one, they are conducted only infrequently, typically once a decade or so. Secondly, they are generally designed to help planners predict where traffic congestion (and its side effects, such as air pollution) will be most severe. As a result, biking is typically an afterthought. For instance, the most recent iteration of the New York metro area’s survey only managed to capture four cycling trips in the Bronx and 5 in Staten Island (combined, home to nearly two million people). As the figure below illustrates, this paints a pretty incomplete picture of cycling in the city. Furthermore, the dataset is limited to the work week; this of course makes sense if you care primarily about traffic congestion. But for cycling research, it all but renders the dataset useless.

There is an aphorism in policy circles that “you can’t manage what you can’t measure” (apparently a misquotation of W. Edwards Deming), and the lack of information about cycling has left us, in many places, bicycle-blind. What can we do about it? Certainly the easiest route is to work on integrating cycling questions into existing surveys such as the American Community Survey and the National Household Travel Survey. For instance, some people use bicycles to access transit, yet the ACS only allows respondents to indicate one mode of travel to work. Many who cycle for part of their trip may thus be counted as “transit riders” only. Expanding the survey question to include multimodal travel would be an important first step. This alteration would find support not just among cycling advocates and scholars; data on multimodal travel data would appeal to the public transportation community as well.
The use of landline phones as the primary method of obtaining data in the NHTS and regional surveys is anachronistic at best, and biased at worst. Particularly younger people, people of color, and immigrants are less likely to have a landline phone; for many cycling advocates and researchers, these are precisely the populations we’d like to know more about. While dual-frame (landline and cell) sampling can increase the cost of surveys considerably, failing to do so may quickly render the surveys obsolete.
Finally, municipalities, metropolitan organizations, and non-profits should attempt to fill the data gap by collecting data in their own backyards. The Los Angeles Bicycle Coalition’s annual bike count is a great example of this. The effort is largely volunteer-operated, and the data collected have helped to elevate the discussion surrounding cycling in southern California considerably.
Increasing the amount and quality of data on bicyclists will not be easy, but doing so will help us cure our “bicycle blindness.”