DISCOVER YOUR LOCAL BICYCLING COMMUNITY
Find local advocacy groups, bike shops, instructors, clubs, classes and more!
Meet Our Bikes Count Winner: Part 2
During May’s Bike Month, the League and Eco-Counter hosted a ‘Bikes Count’ Data Competition that provided two winners with expert cleaning, analysis, and visualization of their bike data. Last month we shared the results of Treasure Valley Cycling Alliance, our advocacy organization winner, now we are sharing how our friends at Eco-Counter helped the City of Charlottesville, Virginia, our community winner, make the most of their bike data in part two of our two-part blog series!
Breathing new life into an automated count program
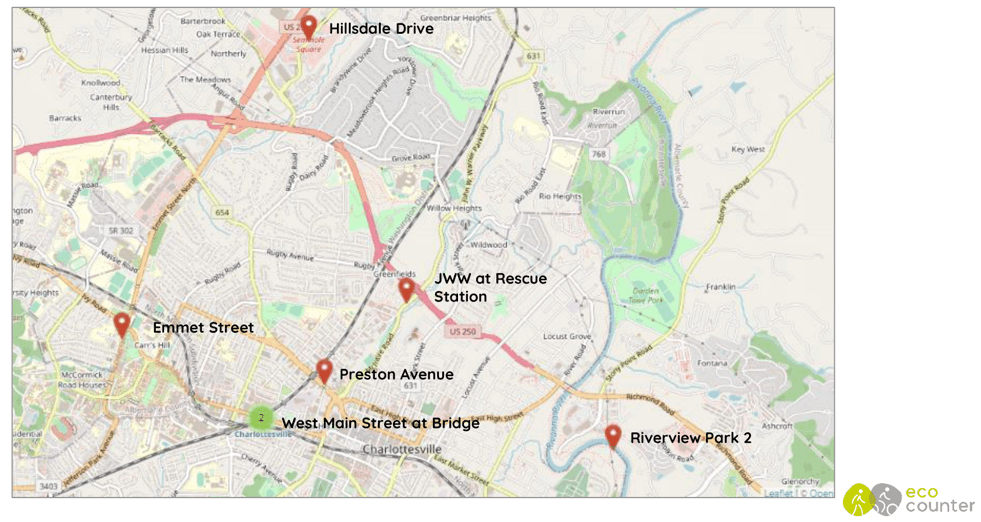
Charlottesville (VA) is a medium-sized city of 50,000, located 100 miles southwest of Washington DC. Home to the University of Virginia’s 17,000 students, the city has particular transportation needs and an increasing network of separated and on-street cycling infrastructure. An active city, nearly 25% of commuters walk, cycle or take public transit. Since spring 2015, the city has collected data on cycling volumes using seven permanent Eco-Counters – including our ZELT bike counter – at six different locations around the city.
Despite six years of continuous bike count data collection – actively shared with the Virginia Department of Transportation – in addition to annual manual count initiatives, city staff have struggled to put the data to good use due to resource constraints. In applying for the grant, bike planners aimed to:
- Understand travel trends over time
- Understand the impacts of current/future infrastructure improvements
- Have access to data that is “clean” and reliable for public sharing
- Regularly present findings to interested stakeholders, staff, elected officials, and the general public
Visualizing bike count trends over time
With these needs in mind, combined with a few brainstorming calls with local bike planners and our data services team, we set about cleaning, analyzing and presenting their data.
First, looking at the most recent full fair-weather season of cycling data (here defined as April 1st 2020 to October 31st 2020) we are able to get a baseline understanding of daily average bike counts across the network.
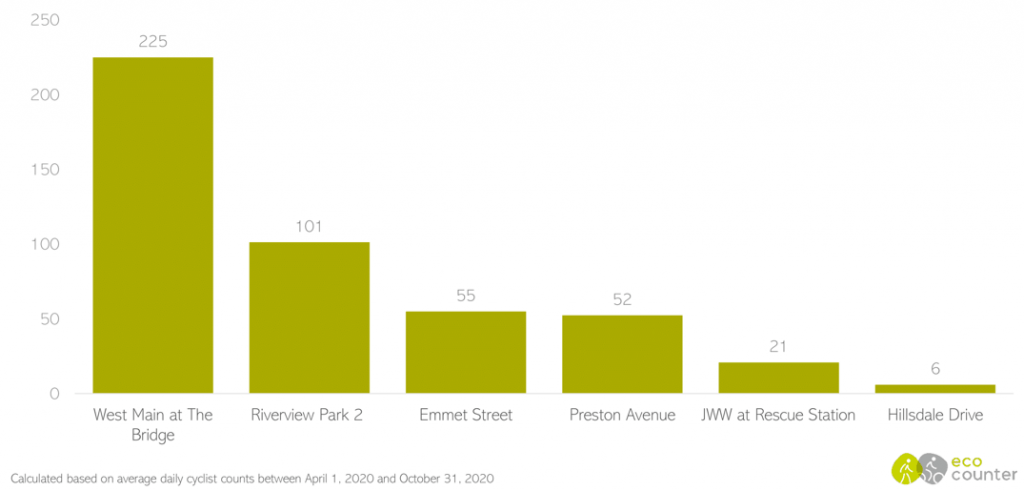
With an average of 225 bikes counted per day, West Main Street at The Bridge leads cycling volumes across Charlottesville’s network. This counter is excellently placed to capture statistically significant trends as it is centrally located and on a principal thoroughfare, almost representing a funnel point in the network.
Isolating just this counting site alone and plotting average weekly counts on the Y axis, five years of data tell an interesting story.