Posts by Ken McLeod
Updated: Bike Commute Data Released
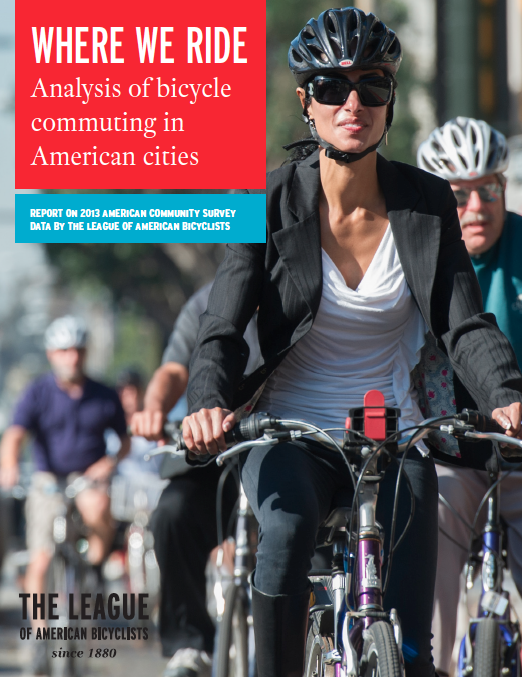
UPDATE: We’ve released an extensive analysis of the new bike commuting data in a new report called “Where We Ride: An Analysis of Bicycle Commuting in American Cities.” Click here to download it (PDF), or scroll through the report below. This morning, the American Community Survey (ACS) released new data on bicycle commuting in the United States.
Read MoreSurvey: Bicyclists Unsure of Connected and Automated Car Technology
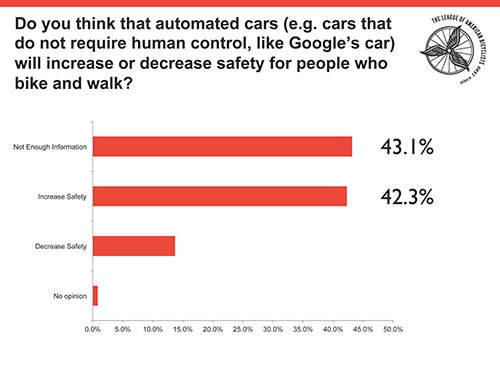
Last Friday I spoke to researchers, agency staff, and industry at the fall meeting of the Technologies for Safe and Efficient Transportation (T-SET) University Transportation Center (UTC) at Carnegie Mellon University (CMU) in Pittsburgh, PA. CMU and the University of Pennsylvania are partners in the US DOT funded UTC that is one of up to 35 UTCs that are funded under MAP-21 with up to $72.5 million per year being allocated to research on a competitive basis. The CMU/UPenn UTC has a strategic goal of safety.
Read MoreShare the Road 2.0
On August 22, I will be participating in a panel discussion at Carnegie Mellon University with researchers, transportation agency staff, and industry leaders about the implications of autonomous and connected vehicles. I am looking forward to the opportunity to share the voice of bicyclists with an audience that may shape the next major transportation revolution in our country and would appreciate your taking this survey in order to let them know how you feel.
Read MoreTell Census Bicyclists Count
How do we know how many people are biking? In most cases, we rely upon the American Community Survey. Each year the Census Bureau releases data on how people get to work, including whether they bike to work. This is the most consistent and widespread data on the number of people regularly biking in the United States. We use it in many ways -– to compare cities large and small, to evaluate communities and states using Bicycle Friendly America programs, and to better understand bicycle safety.
Read MoreBFS: Overall Trends in 2014
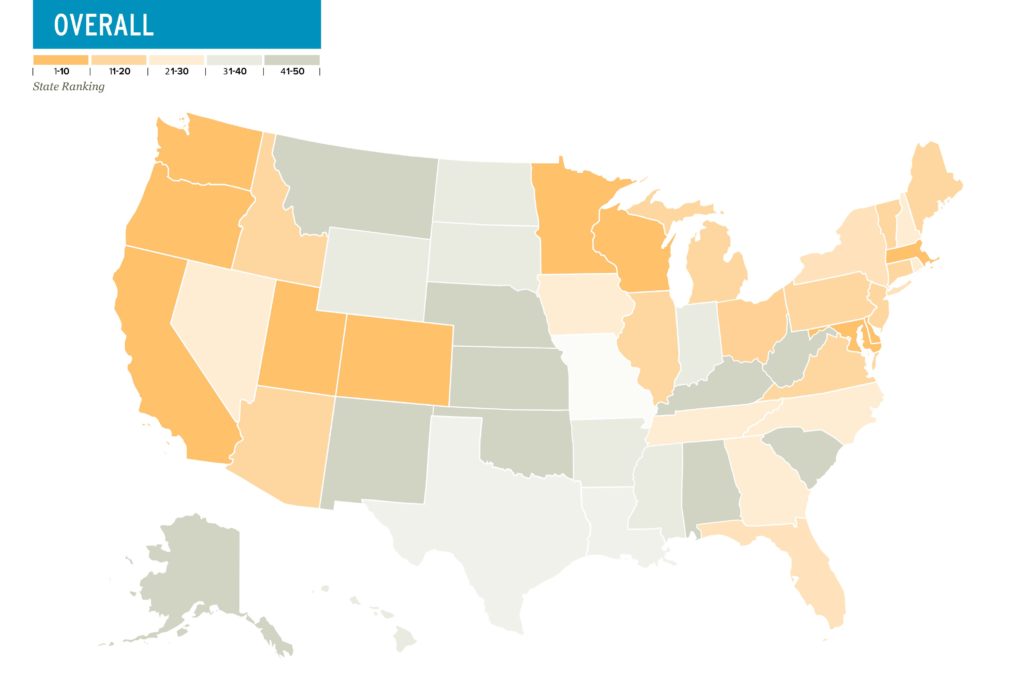
The Bicycle Friendly States ranking is now in its 7th year. Launched in 2008, it has undergone several iterations as we continue to strive to capture what makes a state bicycle friendly. The last major revision to our process was in 2012, when the survey for our Bicycle Friendly State ranking was merged with the survey used for the Alliance for Biking and Walking’s Benchmarking Report. Due to this major revision, this blog only looks at data from the past two years.
Read MoreBFS: Infrastructure & Funding
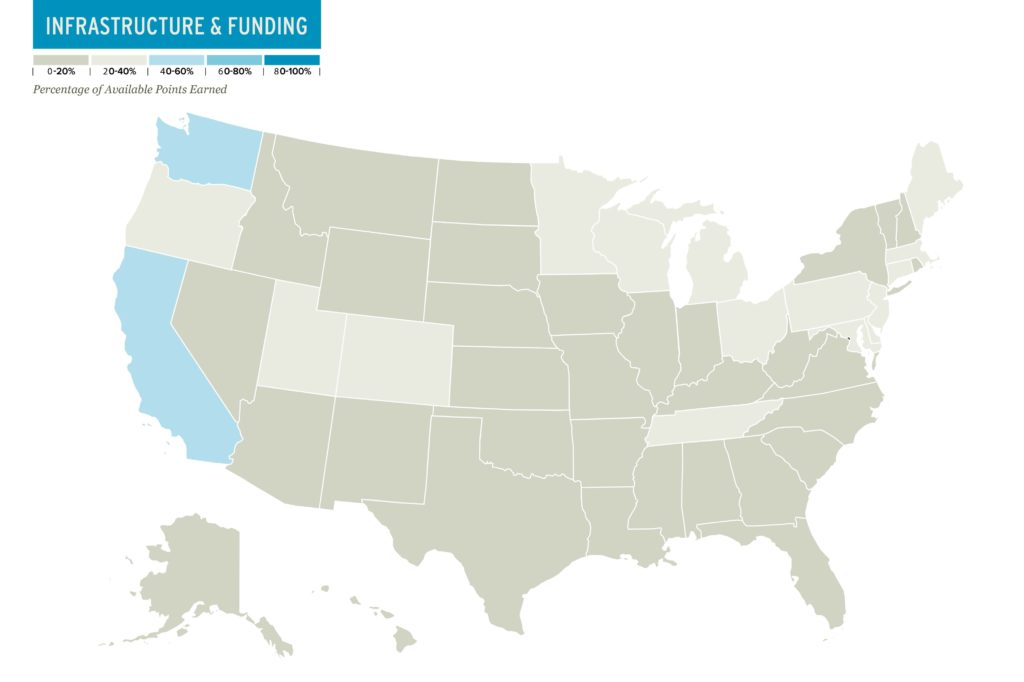
The Infrastructure & Funding category has long been one of the lower scoring categories that make up our Bicycle Friendly State rankings. In this category we ask tough questions about the infrastructure that is actually on the ground, the money from state and federal programs actually committed to bicycling and walking, and state goals and policies that affect funding and building decisions. When looking at long-term average spending on bicycling and walking as a percentage of all federal transportation funds, we see that less than 2% has been spent on bicycling and walking projects. It is not particularly surprising then that states tend to score low in this category.
Read MoreBFS: Evaluation and Planning
Our Evaluation & Planning category showed the second best improvement of any Bicycle Friendly State category this year. This looks at how states plan to accommodate and protect bicyclists. To have good plans and ensure that they are working this category also looks at measurables – such as bicycle commuting rates and bicycle fatalities. This year, we saw a lot of improvement among states that scored either a 1 or a 2 in this category last year. Hopefully this means that these states are putting plans in place to increase cycling rates and decrease cycling-related fatalities, and that we will be reporting on those successes in the future.
Read MoreBFS: Programs & Policies
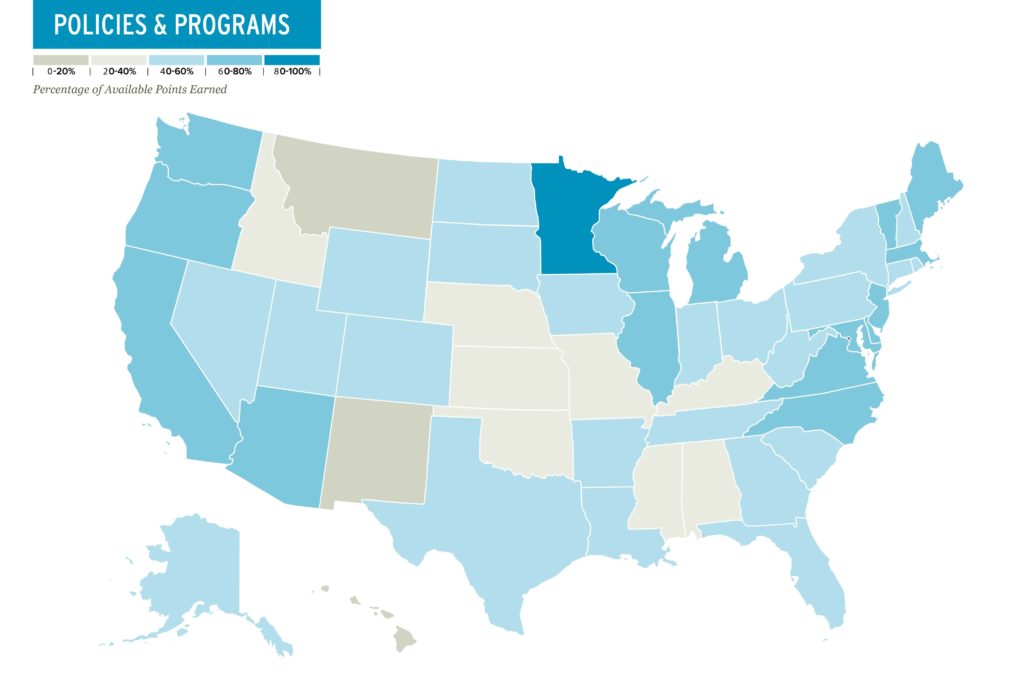
When we examine Policies and Programs as part of our annual Bicycle Friendly State ranking we are primarily looking at the policies that accommodate bicyclists and state staff time for bicycling-related programs. Examples of policies that accommodate bicyclists include complete streets policies, facility design guidelines, bicycle parking policies, and bridge and tunnel access policies.
Read MoreNew: Census Data on Bike Commuting
Today the Census Bureau released its newest report on commuting in America, heralding a 60 percent increase in bike commuting in America over the past decade. We’ll be discussing this new report with Census Bureau staff via Google Hangout next Tuesday, May 13, at 12 p.m. Tune in here.
Read MoreState Trends: Education & Encouragement
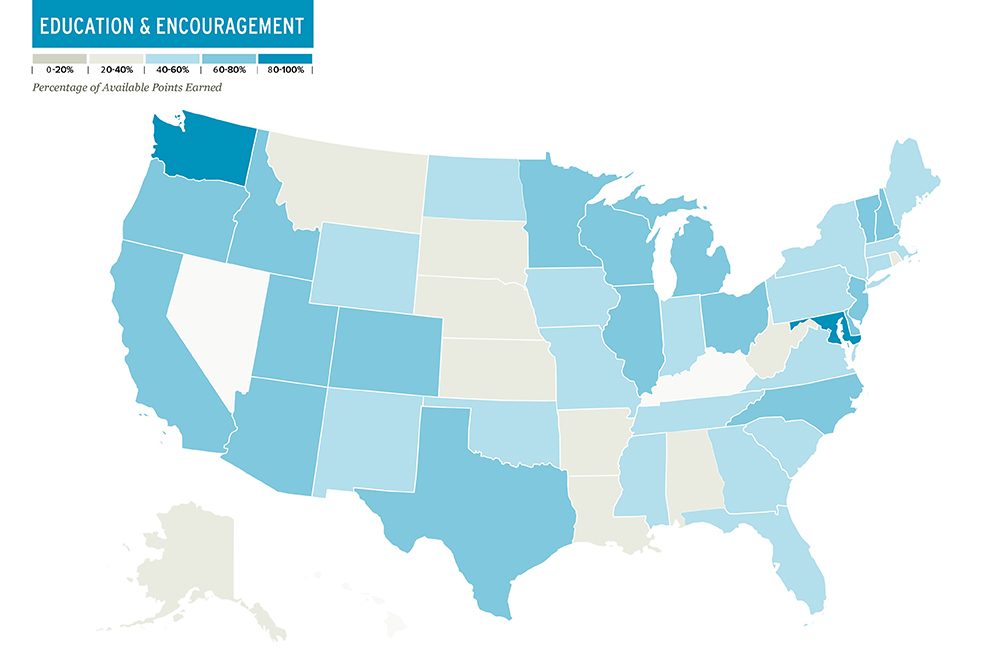
Last week, we announced our 2014 Bicycle Friendly State Ranking and, to give you greater insight into the annual assessment, we’re breaking down each of the categories and identifying key trends. Education & Encouragement is a category in which many states excel. This can be seen in the strong growth in Signs of Success associated with the Education & Encouragement category.
Read More