DISCOVER YOUR LOCAL BICYCLING COMMUNITY
Find local advocacy groups, bike shops, instructors, clubs, classes and more!
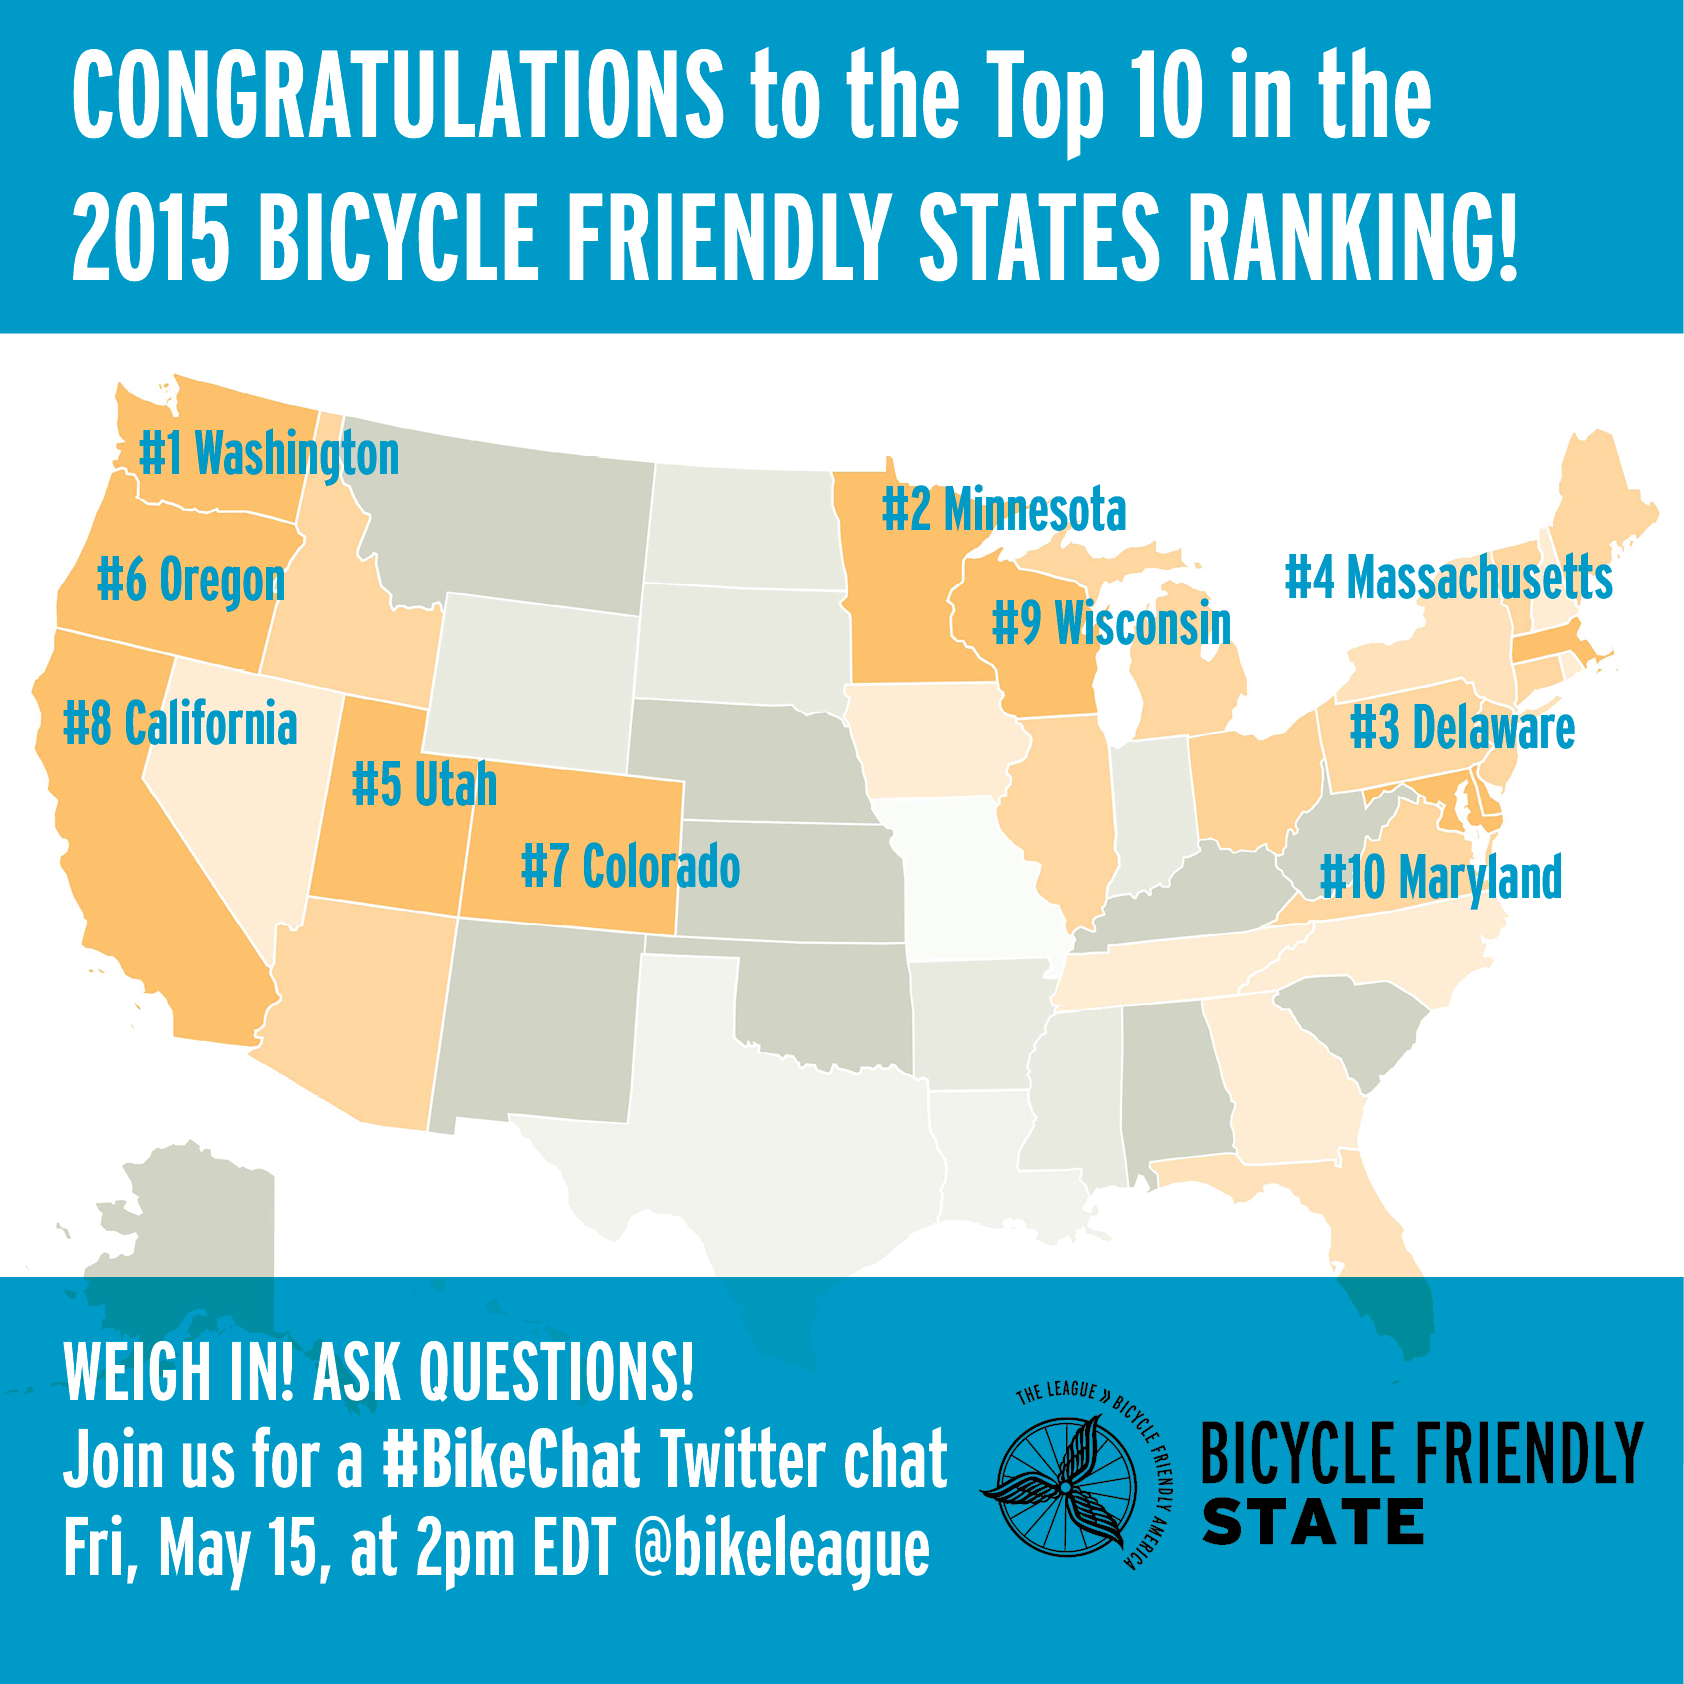
How Do We Rank The States?
 Every year we do a survey with the same name, and every year, it’s a little different. This year, we added several new questions to our Bicycle Friendly State survey and changed how some questions were scored in response to feedback from state bicycle and pedestrian coordinators and statewide bicycle advocacy groups.
The Bicycle Friendly State ranking could not happen without the hard work of state Department of Transportation bicycle and pedestrian coordinators and statewide bicycle advocacy groups. They put in a tremendous amount of time and effort that makes our annual rankings and the Alliance for Biking and Walking’s bi-annual Benchmarking Report possible. Bicycling and walking is a tremendously dynamic field and recent surveys reflect this dynamism with ever updated standards.
Some of the new questions this year included:
- Was the state DOT bike/ped coordinator position vacant for any part of 2014?
- Has the state adopted the NACTO urban streets design guide?
- Are protected bike lanes installed on any state highway in the state?
- Are standard bike lanes installed on any state highway in the state?
We tried our best to keep the overall available points the same. In response to new questions and feedback received, here are a few questions that had changes in points this year:
Increases in points
- Does your state have mode share goals for biking and/or walking?
- Is bicycle and pedestrian safety an emphasis area in the state Strategic Highway Safety Plan?
- Does your state have a texting ban for all drivers?
- Does your state have language in its vehicle code prohibiting a motorist from opening an automobile’s door unless the motorist is able to do so safely?
Reductions in points
- Survey data related to FTE hours spent on biking and walking. States had varying understandings of these questions and it was hard to be consistent in scoring.
- Survey data related to law enforcement data. States had varying understandings of these questions and it was hard to be consistent in scoring.
We also created formulas to score federally available data, which should help our rankings be more consistent and predictable in the future. The factors that are scored in our formulas are outlined in the short report – “Using Federal Data for Bicycle Friendly States” – which details how we analyze:
- Federal spending data
- Federal fatality data
- Federal commuting data
Federal data is great for understanding basics about biking in each state and is often the best source for understanding changing state conditions. However, it can also be limited and usually lags behind the action done by state DOTs, legislatures, executives, and advocates. The short report should provide a primer for anyone interested in the annual federally available data relevant to biking and some of the ways to give it context to understand conditions in their state. Many of the same analytical tools are used as part of our Bicycle Friendly Community program.
Interested in learning more about how we use federal data in our ranking methodology? Read this mini-report to get all the details.
Please get in touch with me at [email protected] if you are interested in knowing more about your community based on these data sources.