DISCOVER YOUR LOCAL BICYCLING COMMUNITY
Find local advocacy groups, bike shops, instructors, clubs, classes and more!
Webinar Recap: Lessons from the 2022 Bikes Count Data Competition Winners
On Wednesday, October 26th, the League co-hosted a webinar with data collection experts from our partners at Eco-Counter to share the results of our 2022 ‘Bikes Count’ Data Competition. The three winners of the competition, Lincoln-Lancaster County Planning Department, Madison Bikes and Bike Fitchburg, received expert analysis, optimization and visualization of their existing bike data from Eco-Counter’s data services team plus training on best practices for analyzing and communicating bike data.
From manual counts to surveys, bike parking data to automated counts, bike data is more available than ever. Analyzing, organizing and communicating that data for meaningful change, however, remains challenging and under-discussed. The winners of the competition shared their success stories and challenges around conducting and best utilizing bike counts in their journey to be better for those who bike in their communities.
WHY DOES COLLECTING AND OPTIMIZING BIKE DATA MATTER?
- Makes The Case For Investment: the ultimate goal is to build bike infrastructure and networks to accommodate the many people in your community who are bicycling. By knowing how many people bike in your community, and specifics like where and why, can help you build a case for investing in improvements for bicycling like bike lanes.
- Tracks Progress: collecting and tracking bike data helps monitor the success of bicycle master plans and creates a better understanding of areas in need of improvement.
- Supports Long-term Goals: whether your goal is continuously supporting safe streets for all or informing longer-term climate and sustainability objectives, data is an essential tool to support initiatives.
Quick Takeaways from the Winners:
LINCOLN-LANCASTER COUNTY PLANNING DEPARTMENT
- Ridership in Lincoln, NE, is strongest on trails and cycle tracks.
- Lincoln has a great winter retention rate (30% compared to peak warm-weather cycling season).
- Collecting bike data captured notable differences in ridership in relation to bike lane design. In most cases, better bike infrastructure, like protected bike lanes, see higher rates of people riding.
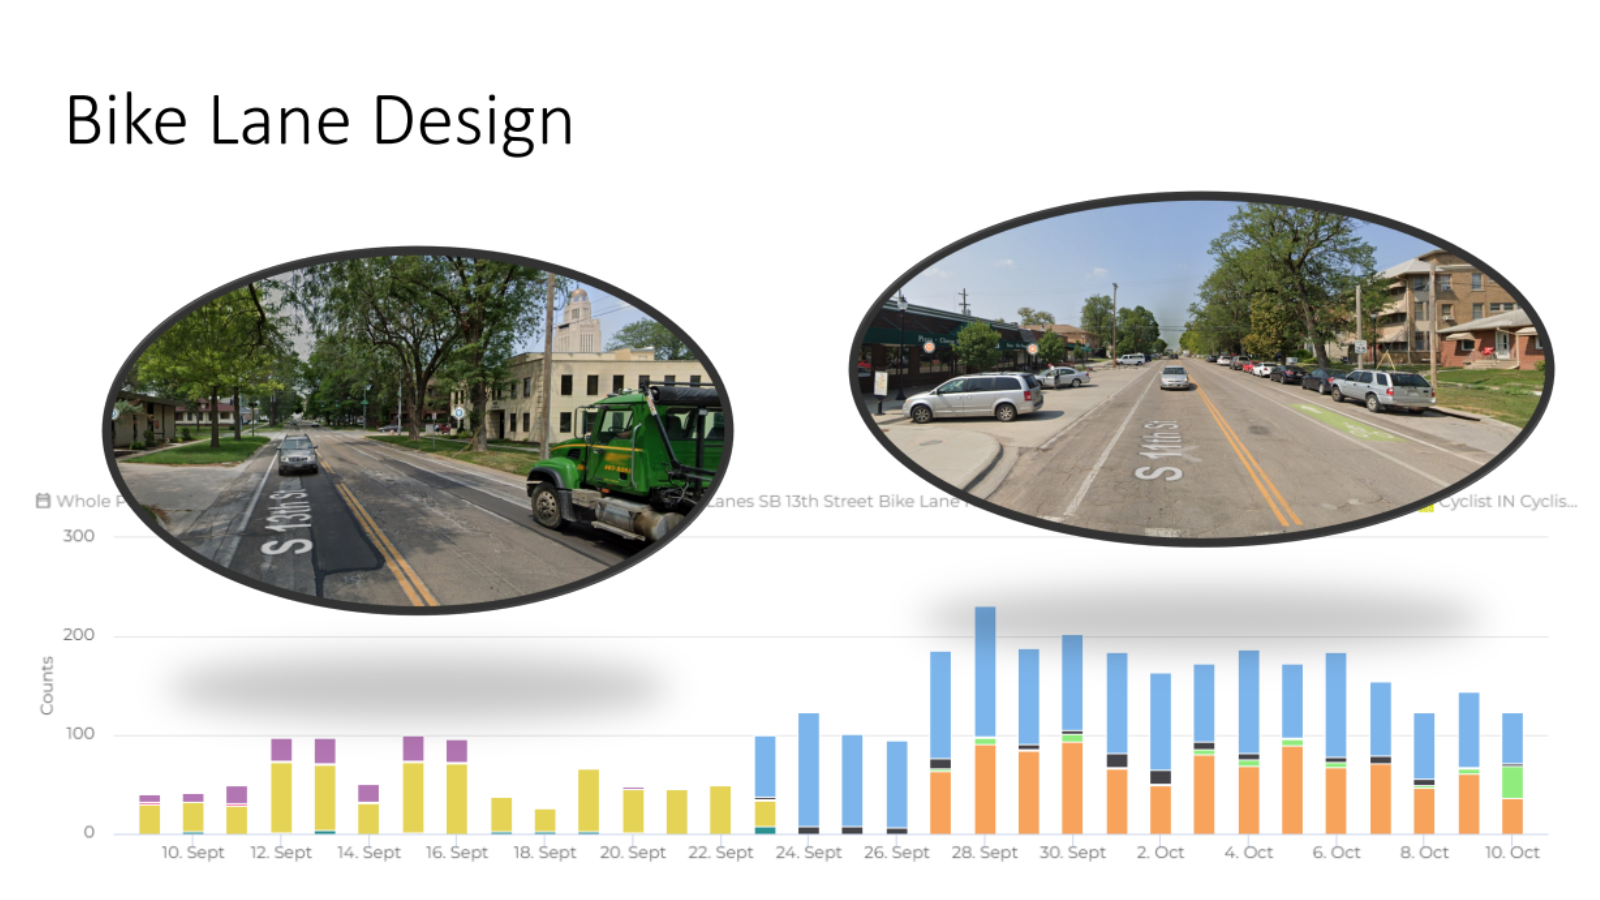
Pro-Tip: make it easier for the community to engage with your bike data collection. Lincoln-Lancaster reports bike data to an interactive webpage that displays all the manual and automatic counters located across the community.
Check out more of Lincoln-Lancaster County Planning Department’s bike data.
MADISON BIKES AND BIKE FITCHBURG
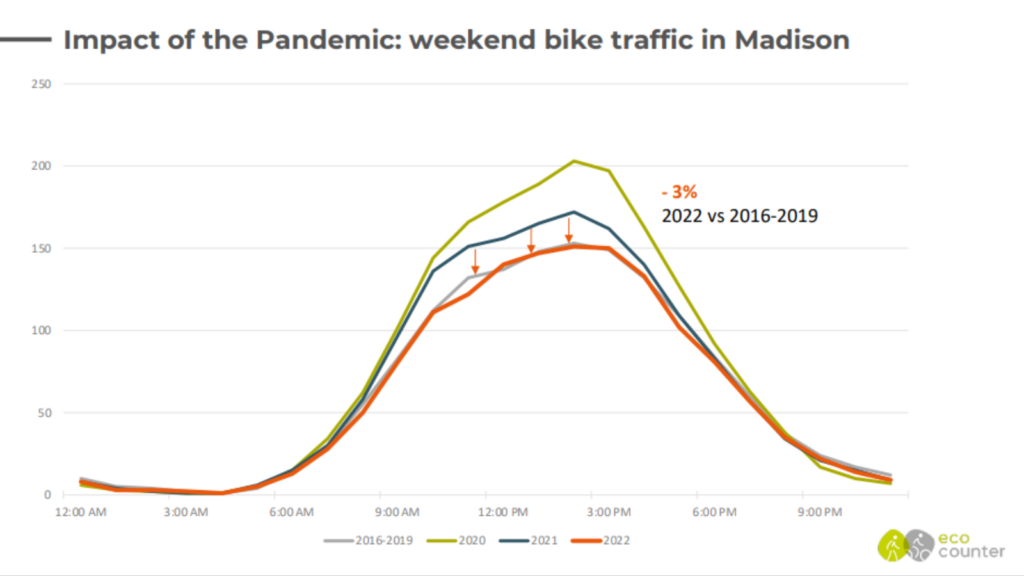
- Like many cities across the U.S., the pandemic created a dramatic increase in ridership in Madison and Fitchburg as well as a steadily higher rate of cycling occurring on the weekend vs the weekday.
- Fitchburg used its Silver BFC status as a motivator for bike count investment. The city increased funding to purchase counters as part of their strategy to reach Gold BFC status.
- Some of Madison’s highest overall counts are important cycling axes connecting the neighboring communities of Madison and Fitchburg.
Pro-Tip: reach out to neighboring communities to share bike data and build a stronger case for building connected infrastructure. The League added regional coordination to our BFC application updates to encourage making connections between and across communities.
Check out more of Madison Bikes and Bike Fitchburg’s bike data.
Watch the webinar recording below or for more insight, you can find previous data webinars on the League’s Youtube channel and existing resources for building a Bicycle Friendly Community here!